Large Scale Landuse Classification of Satellite Imagery
Suneel Marthi
February 27, 2019
Big Data Technology Summit, Warsaw, Poland
$WhoAmI
-
Suneel Marthi
@suneelmarthi- Member of Apache Software Foundation
- Committer and PMC on Apache Mahout, Apache OpenNLP, Apache Streams
Agenda
- Introduction
- Satellite Image Data Description
- Cloud Classification
- Segmentation
- Apache Beam
- Beam Inference Pipeline
- Future Work
Introduction
Deep Learning has moved from Academia to Industry
Availability of Massive Cloud Computing Power
Combination of Compute Resources + Big Data with Deep Learning models often produces useful and interesting applications
Introduction
Computer Vision for Satellite Imagery
Availability of low cost satellite images for research
Train a Deep Learning model to identify Tulip beds from satellite data
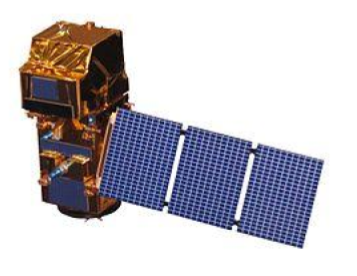
Data: Sentinel-2
Earth observation mission from ESA
13 spectral bands, from RGB to SWIR (Short Wave Infrared)
Spatial resolution: 10m/px (RGB bands)
5 day revisit time
Free and open data policy
Workflow
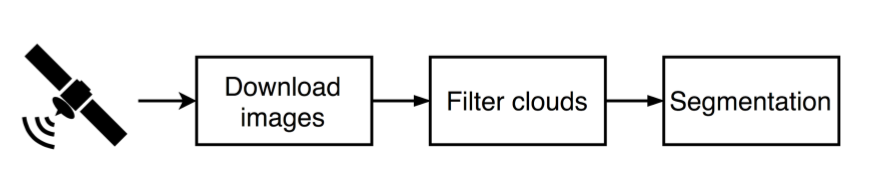
Goal: Identify Tulip fields from Sentinel-2 satellite images
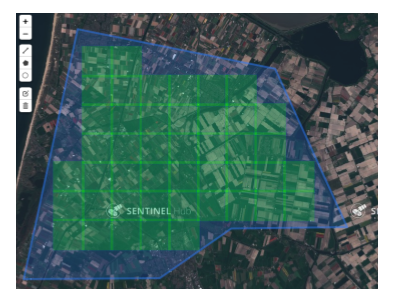
Data acquisition
Images downloaded using Sentinel Hub’s WMS (web mapping service)
Download tool from Matthieu Guillaumin (@mguillau)
 |
 |
Data
256 x 256 px images, RGB
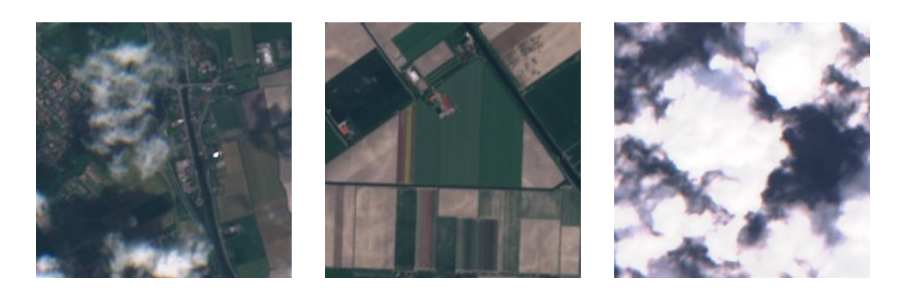
Workflow
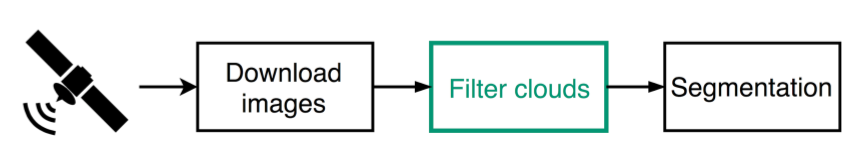
Filter Clouds
Need to remove cloudy images before segmenting
Approach: train a Neural Network to classify images as clear or cloudy
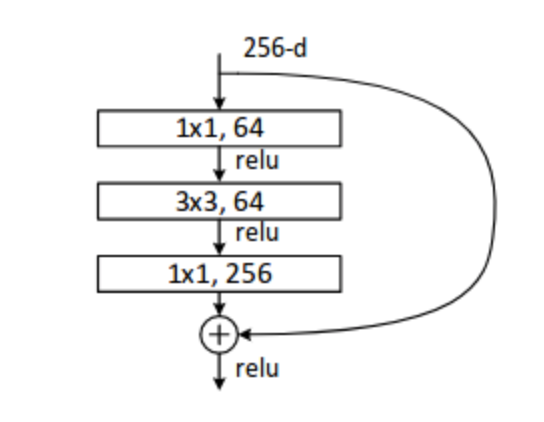
CNN Architectures: ResNet50 and ResNet101
ResNet building block
Filter Clouds: training data
‘Planet: Understanding the Amazon from Space’ Kaggle competition
40K images labeled as clear, hazy, partly cloudy or cloudy
Filter Clouds: Training data(2)
| Origin | No. of Images | Cloudy Images |
|---|---|---|
| Kaggle Competition | 40000 | 30% |
| Sentinel-2(hand labelled) | 5000 | 50% |
| Total | 45000 | 32% |
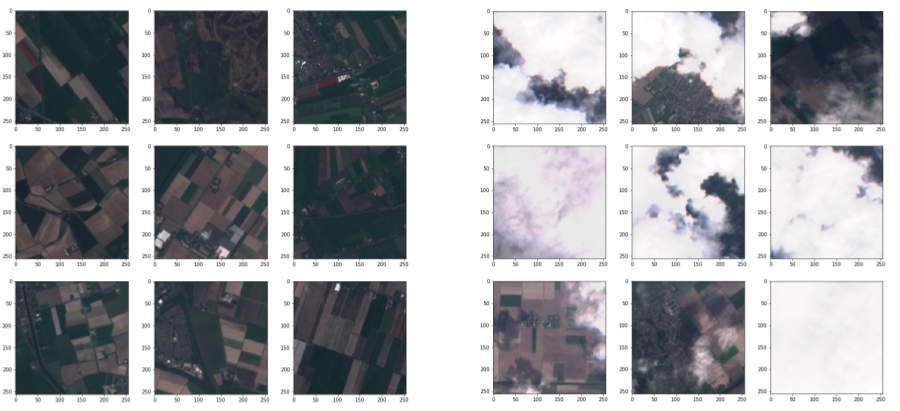
Only two classes: clear and cloudy (cloudy = haze + partly cloudy + cloudy)
Training data split
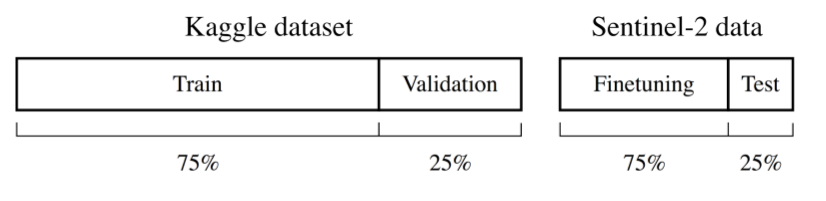
Results
| Model | Accuracy | F1 | Epochs (train + finetune) |
|---|---|---|---|
| ResNet50 | 0.983 | 0.986 | 23 + 7 |
| ResNet101 | 0.978 | 0.982 | 43 + 9 |
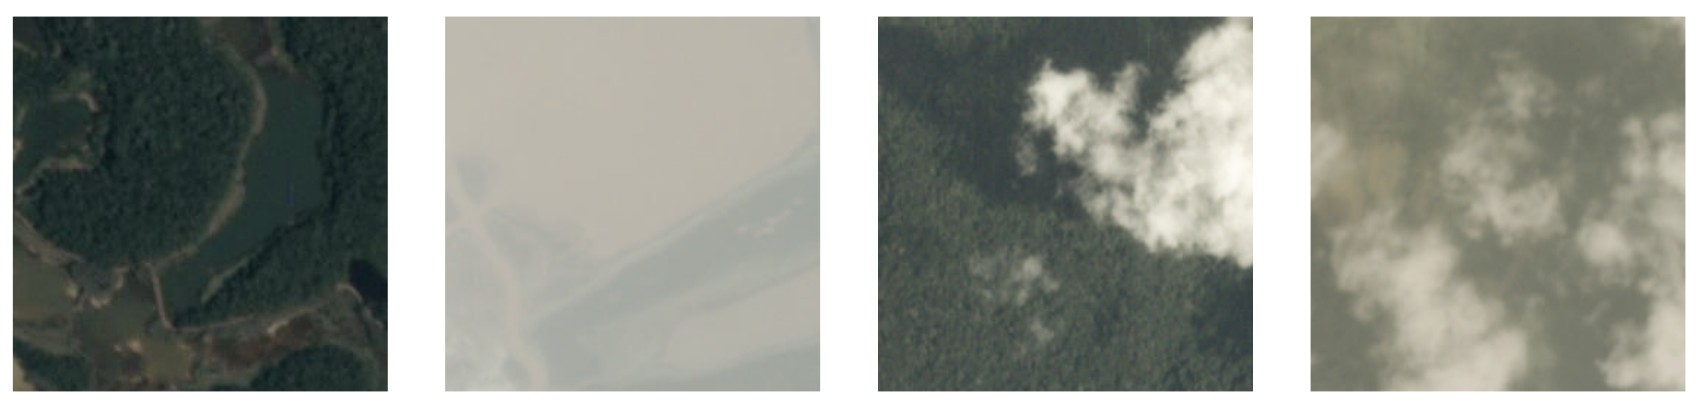
Choose ResNet50 for filtering cloudy images
Example Results
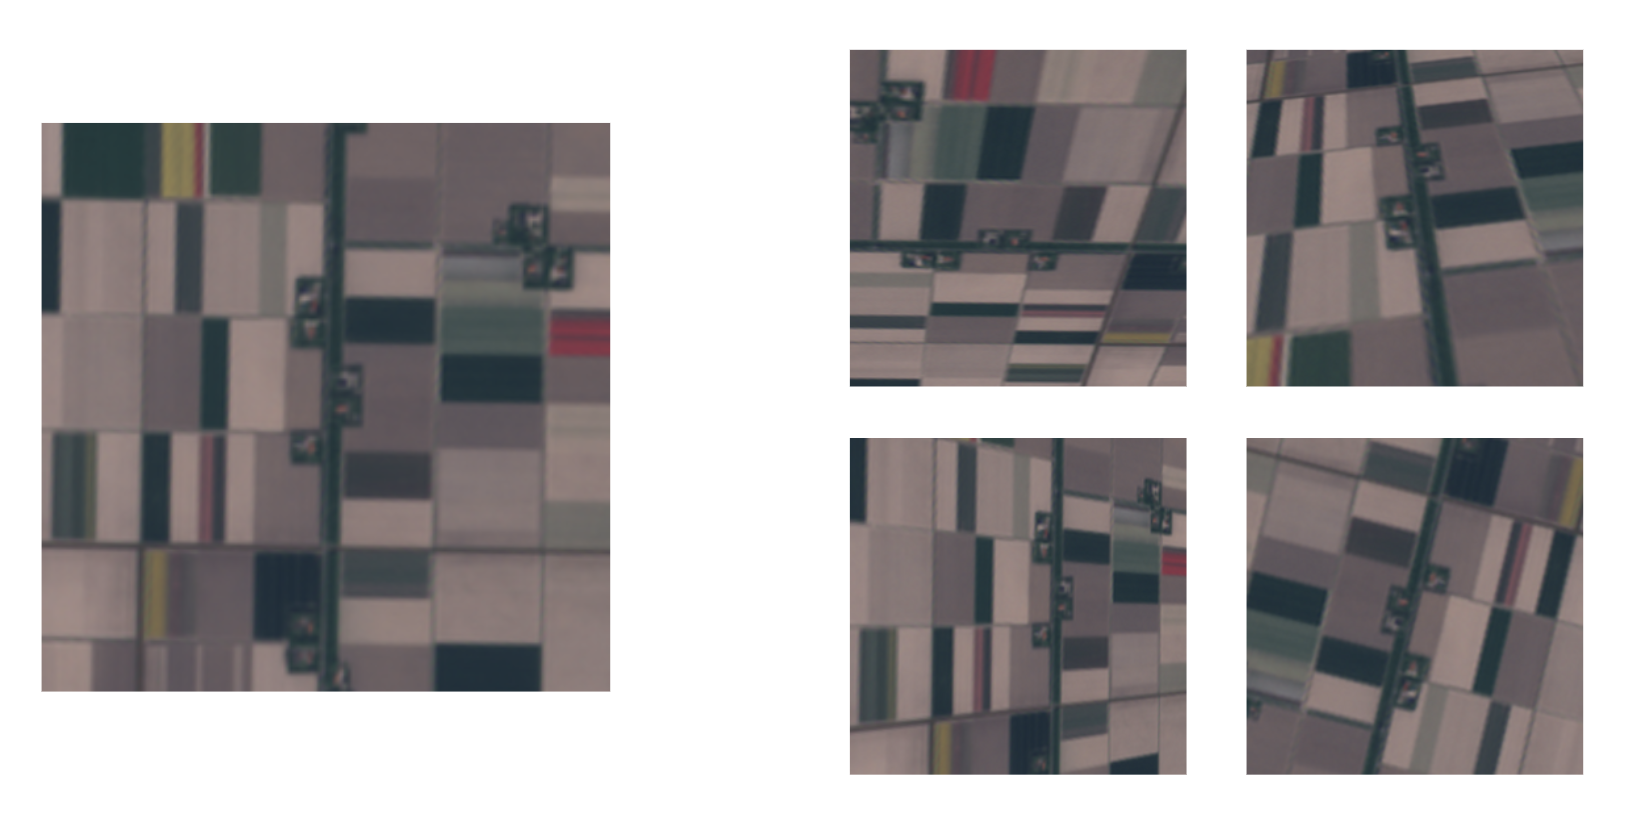
Data Augmentation

                import Augmentor

                p = Augmentor.Pipeline(img_dir)

                p.skew(probability=0.5, magnitude=0.5)
                p.shear(probability=0.3, max_shear=15)
                p.flip_left_right(probability=0.5)
                p.flip_top_bottom(probability=0.5)
                p.rotate_random_90(probability=0.75)
                p.rotate(probability=0.75, max_rotation=20)
Example Data Augmentation
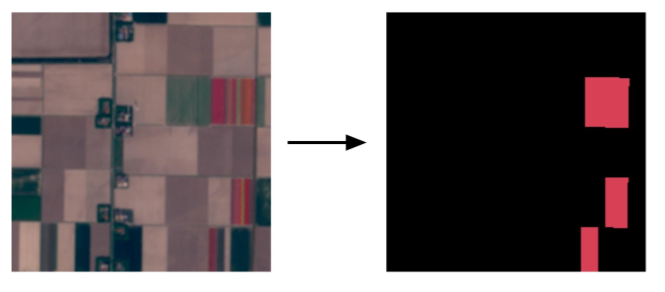
Workflow
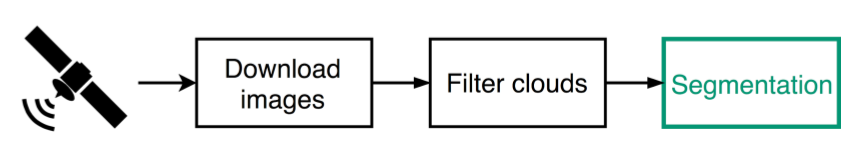
Segmentation Goals
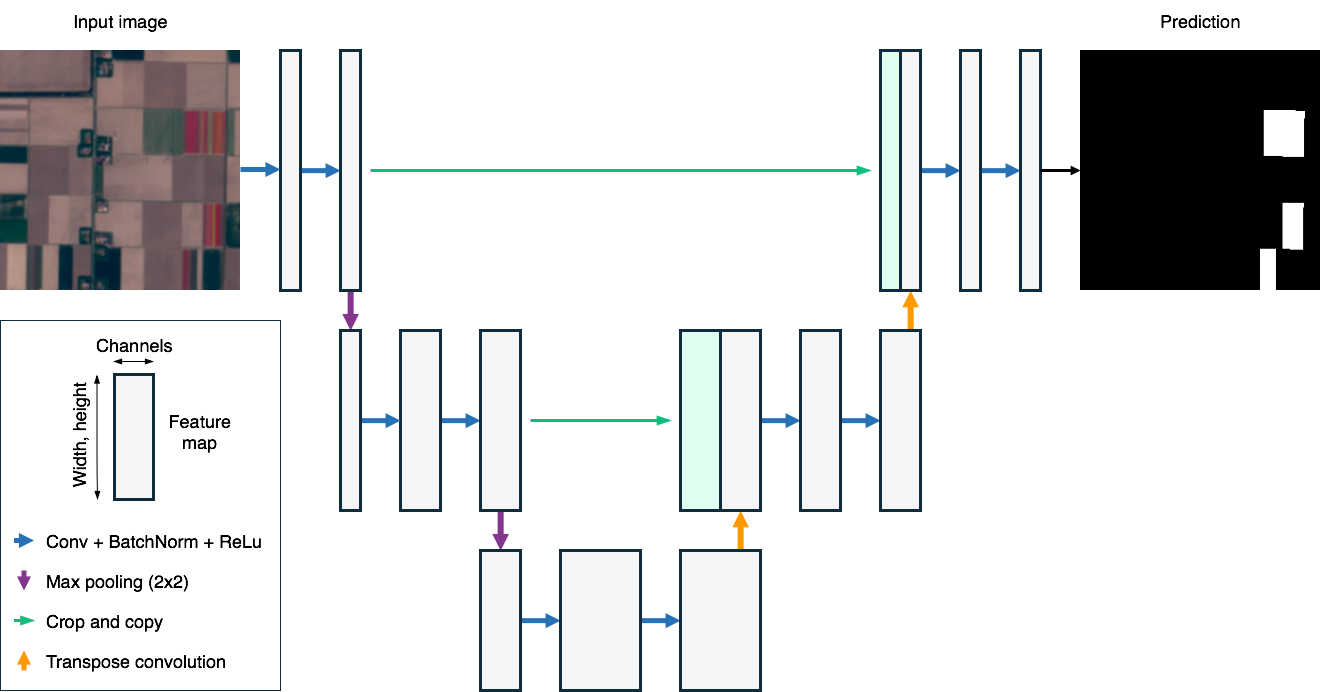
Approach U-Net
- State of the Art CNN for Image Segmentation
- Commonly used with biomedical images
- Best Architecture for tasks like this
O. Ronneberger, P.Fischer, and T. Brox. U-net: Convolutional networks for biomedical image segmentation. arxiv:1505.04597, 2015
U-Net Architecture
U-Net Building Blocks
                def conv_block(channels, kernel_size):
                   out = nn.HybridSequential()
                   out.add(
                       nn.Conv2D(channels, kernel_size, padding=1, use_bias=False),
                       nn.BatchNorm(),
                       nn.Activation('relu')
                   )
                   return out
                def down_block(channels):
                   out = nn.HybridSequential()
                   out.add(
                       conv_block(channels, 3),
                       conv_block(channels, 3)
                   )
                   return out
U-Net Building Blocks (2)
                class up_block(nn.HybridBlock):
                   def __init__(self, channels, shrink=True, **kwargs):
                       super(up_block, self).__init__(**kwargs)
                       self.upsampler = nn.Conv2DTranspose(channels=channels, kernel_size=4,
                                                            strides=2, padding=1, use_bias=False)
                       self.conv1 = conv_block(channels, 1)
                       self.conv3_0 = conv_block(channels, 3)
                       if shrink:
                           self.conv3_1 = conv_block(int(channels/2), 3)
                       else:
                           self.conv3_1 = conv_block(channels, 3)
                   def hybrid_forward(self, F, x, s):
                       x = self.upsampler(x)
                       x = self.conv1(x)
                       x = F.relu(x)
                       x = F.Crop(*[x,s], center_crop=True)
                       x = s + x
                       x = self.conv3_0(x)
                       x = self.conv3_1(x)
                       return x
U-Net: Training data
 |
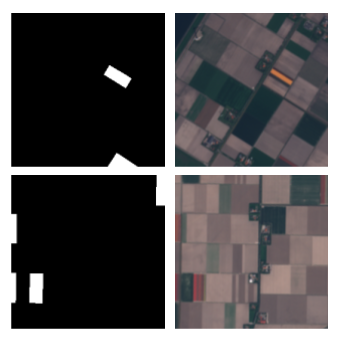 |
Loss function: Soft Dice Coefficient loss
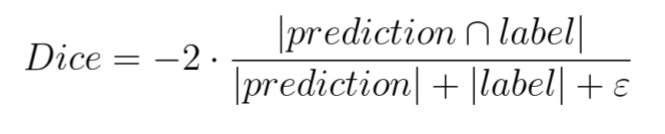
Prediction = Probability of each pixel belonging to a Tulip Field (Softmax output)
ε serves to prevent division by zero
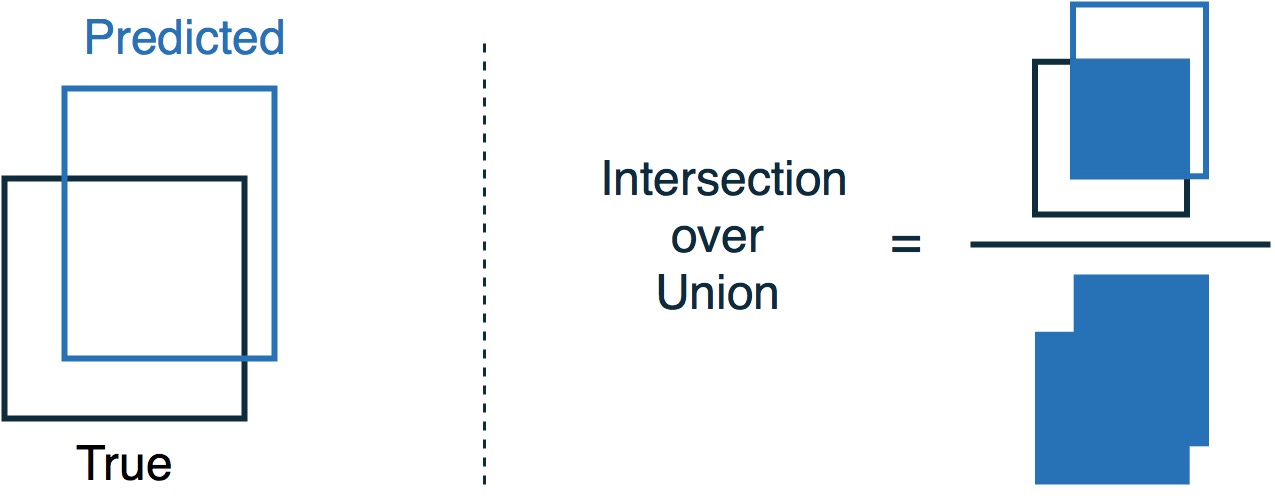
Evaluation Metric: Intersection Over Union(IoU)
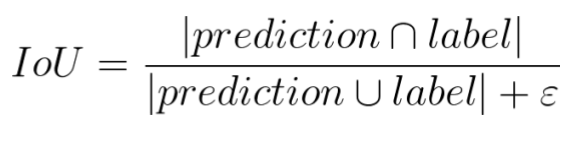
Aka Jaccard Index
Similar to Dice coefficient, standard metric for image segmentation
Evaluation Metric: Intersection Over Union(IoU)
Results
- IoU = 0.73 after 23 training epochs
- Related results: DSTL Kaggle competition
- IoU = 0.84 on crop vs building/road/water/etc segmentation
https://www.kaggle.com/c/dstl-satellite-imagery-feature-detection/discussion/29790
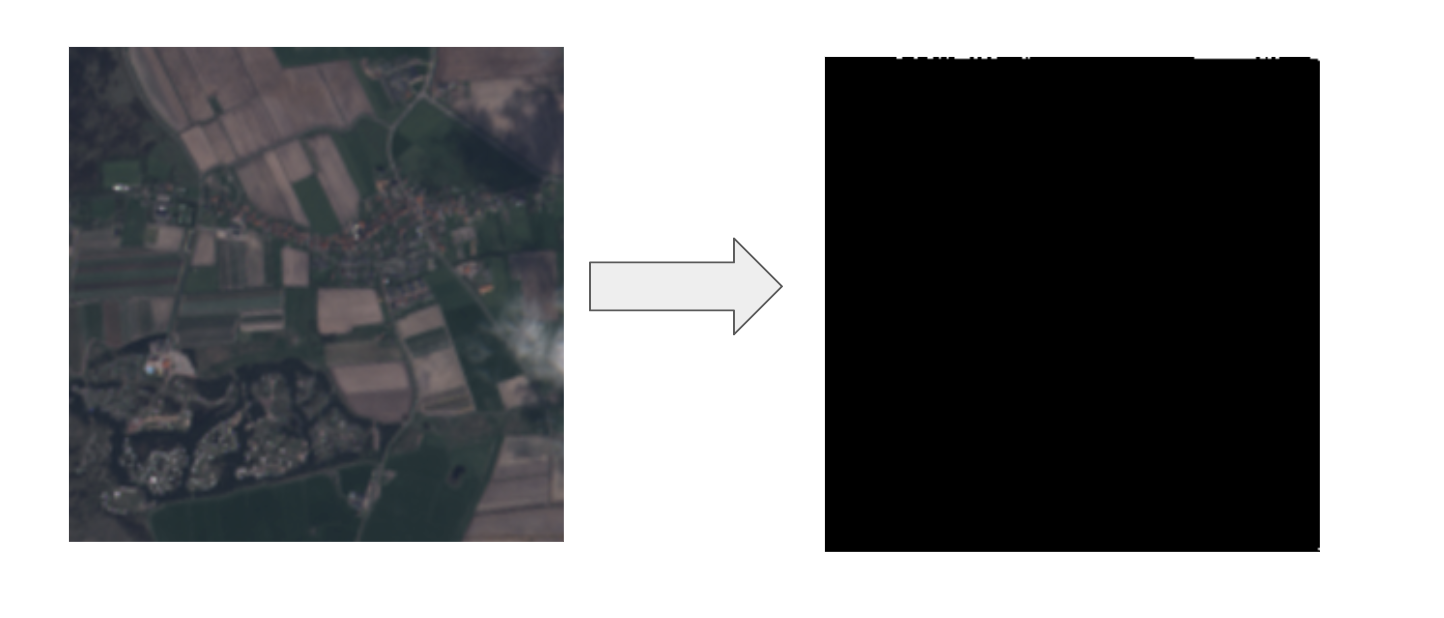
No Tulip Fields
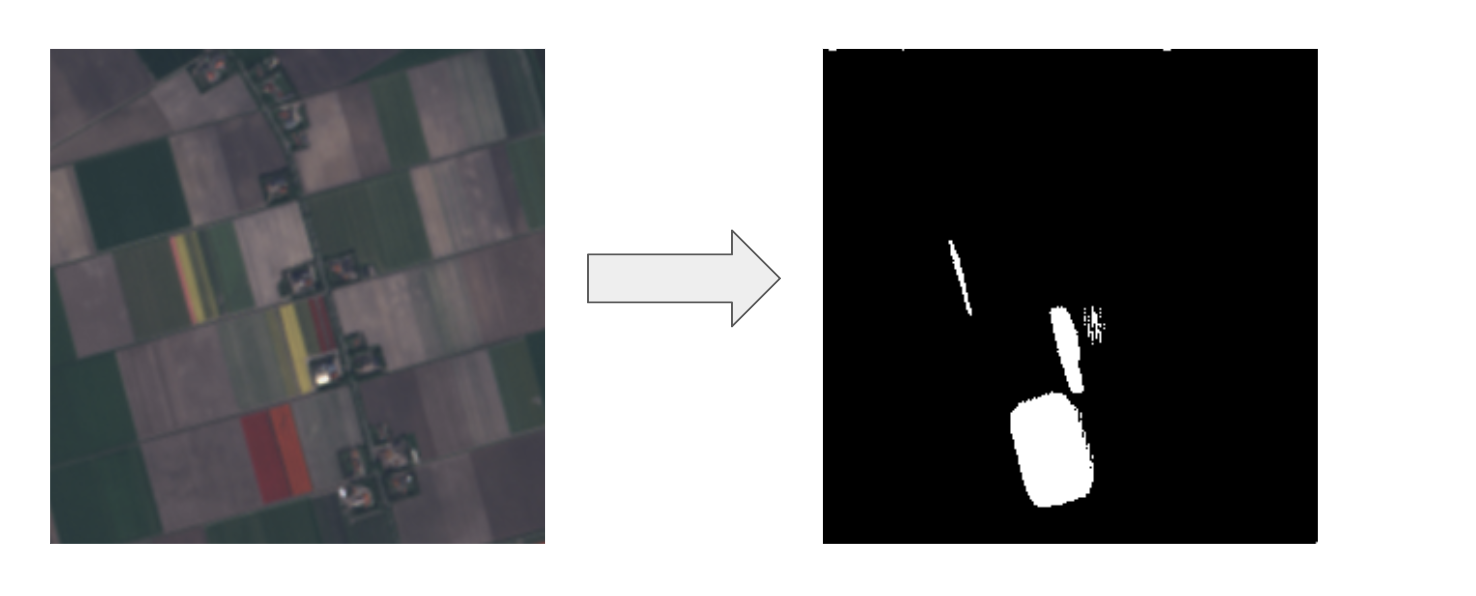
Large Tulip Fields
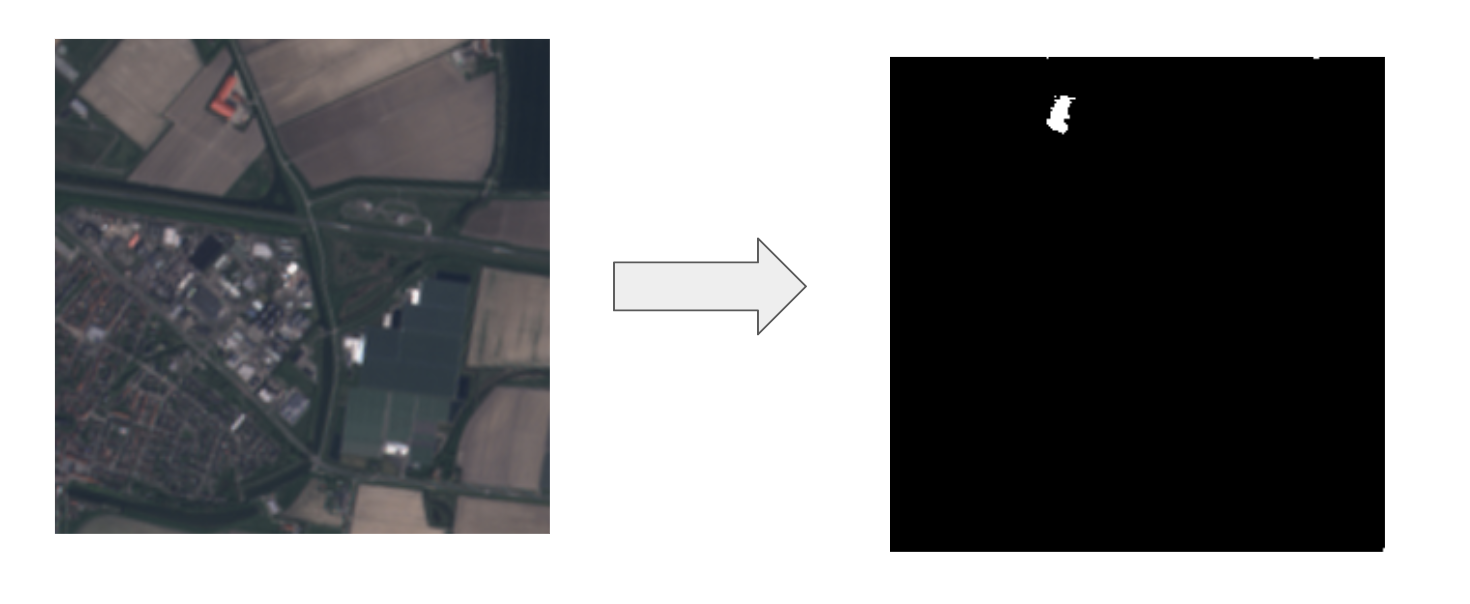
Small Tulips Fields
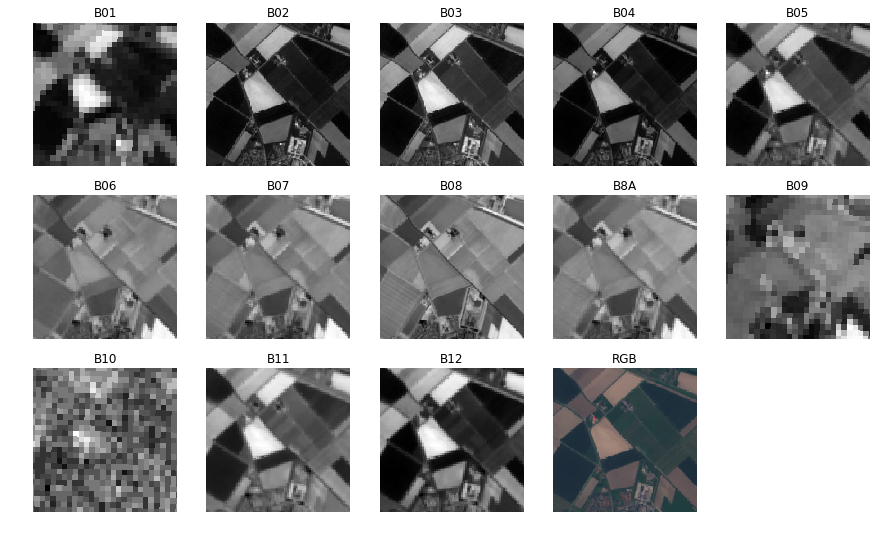
Multi-Spectral Images
- Measures reflectances with wavelength from 440nm - 2200nm
- 13 bands covering - visible, near infrared and shortwave infrared spectrum
https://www.kaggle.com/c/dstl-satellite-imagery-feature-detection/discussion/29790
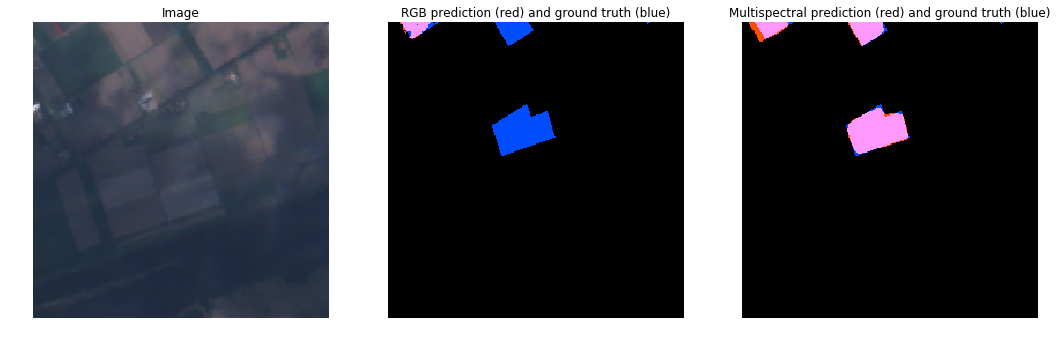
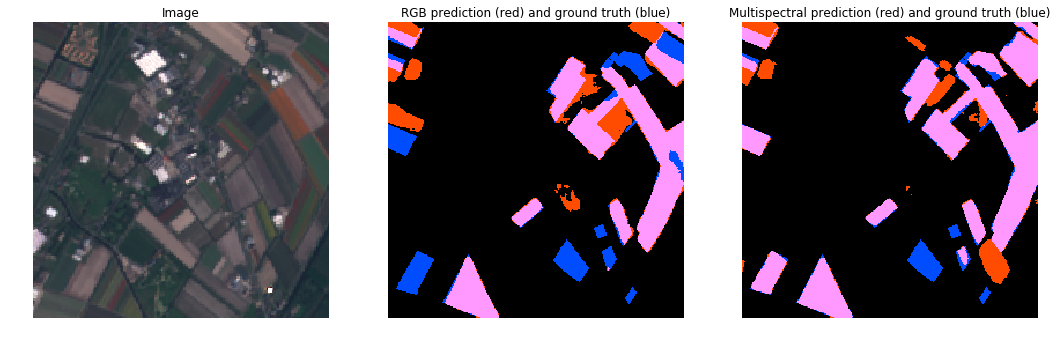
RGB vs MultiSpectral (Full Bloom)
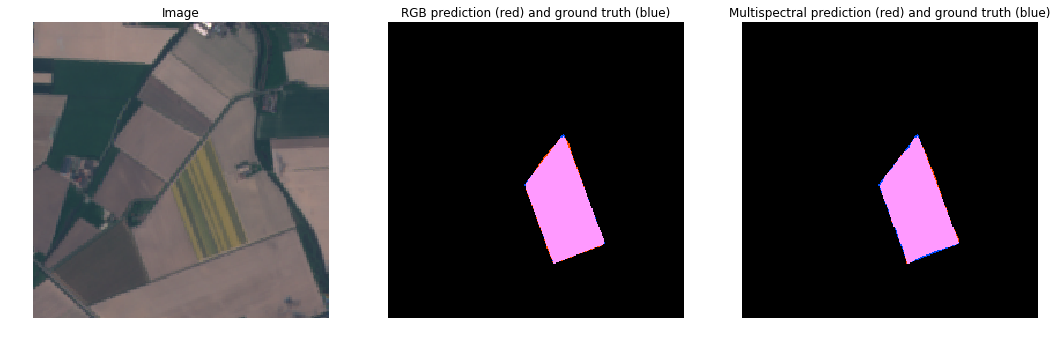
RGB vs MultiSpectral (Full Bloom)
RGB vs MultiSpectral (Cloudy)
RGB vs MultiSpectral (Cloudy)
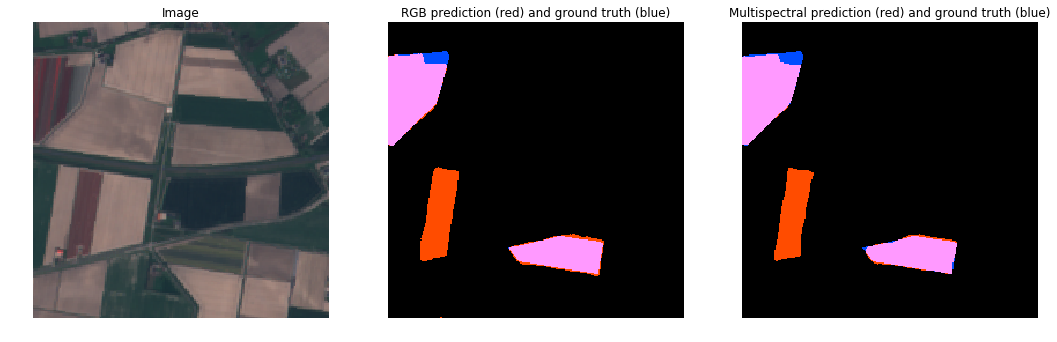
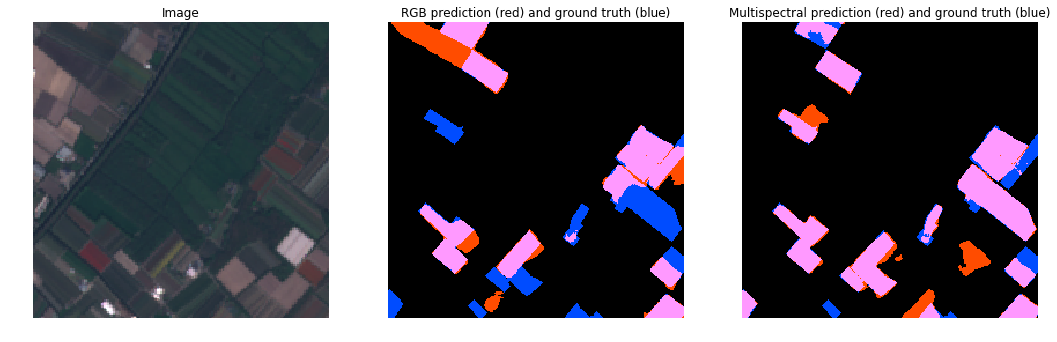
RGB vs MultiSpectral (Complex Tulip Fields)
RGB vs MultiSpectral (Complex Tulip Fields)
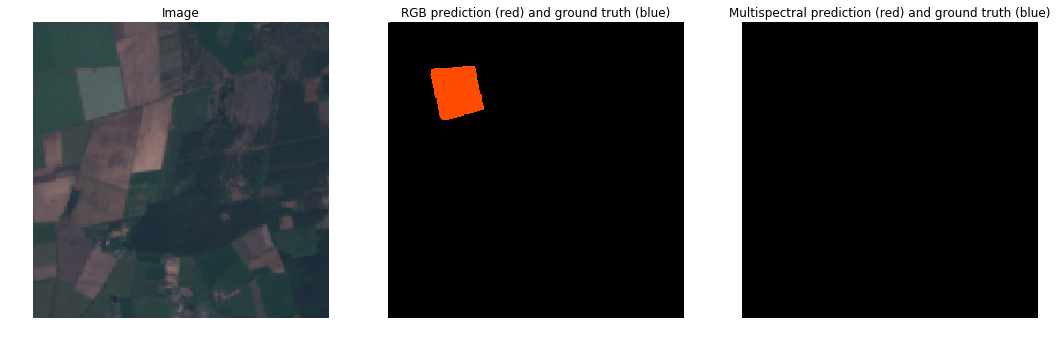
RGB vs MultiSpectral (Tulips Not Obvious)
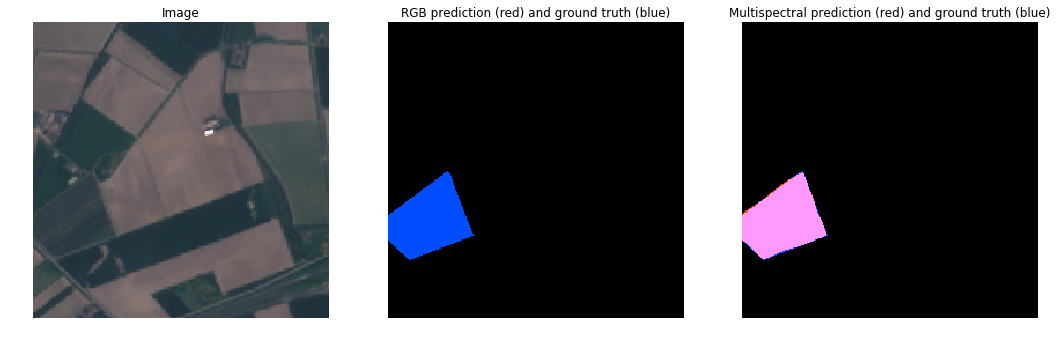
RGB vs MultiSpectral (Tulips Not Obvious)
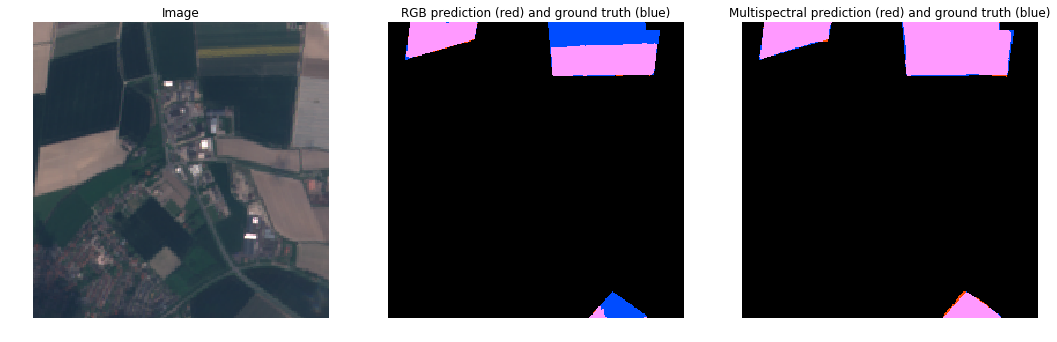
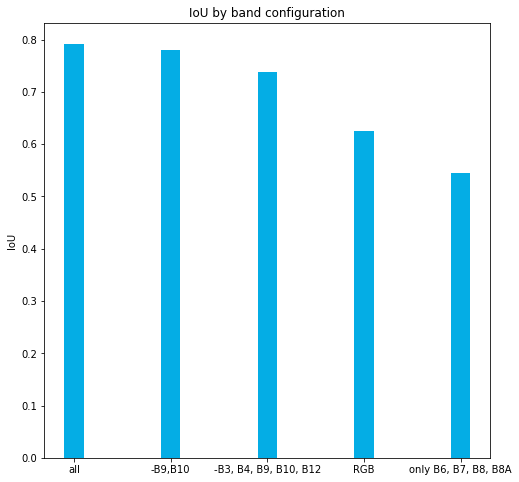
Comparison: RGB vs MultiSpectral
How to Scale - Batch or Stream ?
"Batch is an extension of Streaming, except when Streaming is an extension of Batch"
-- Shannon Quinn, Apache Mahout
Spark or Flink ?
"Spark Streaming is for people who want to operate on their streams using Batch idioms.
Flink Batch is for people who want to operate on their batches using Streaming idioms."
-- Joey Frazee, Apache NiFi
What is Apache Beam?
- Agnostic (unified Batch + Stream) programming model
- Java, Python, Go SDKs
- Runners for Dataflow
- Apache Flink
- Apache Spark
- Google Cloud Dataflow
- Local DataRunner
Why Apache Beam?
- Portability: Code abstraction that can be executed on different backend runners
- Unified: Unified batch and Streaming API
- Expandable models and SDK: Extensible API to define custom sinks and sources
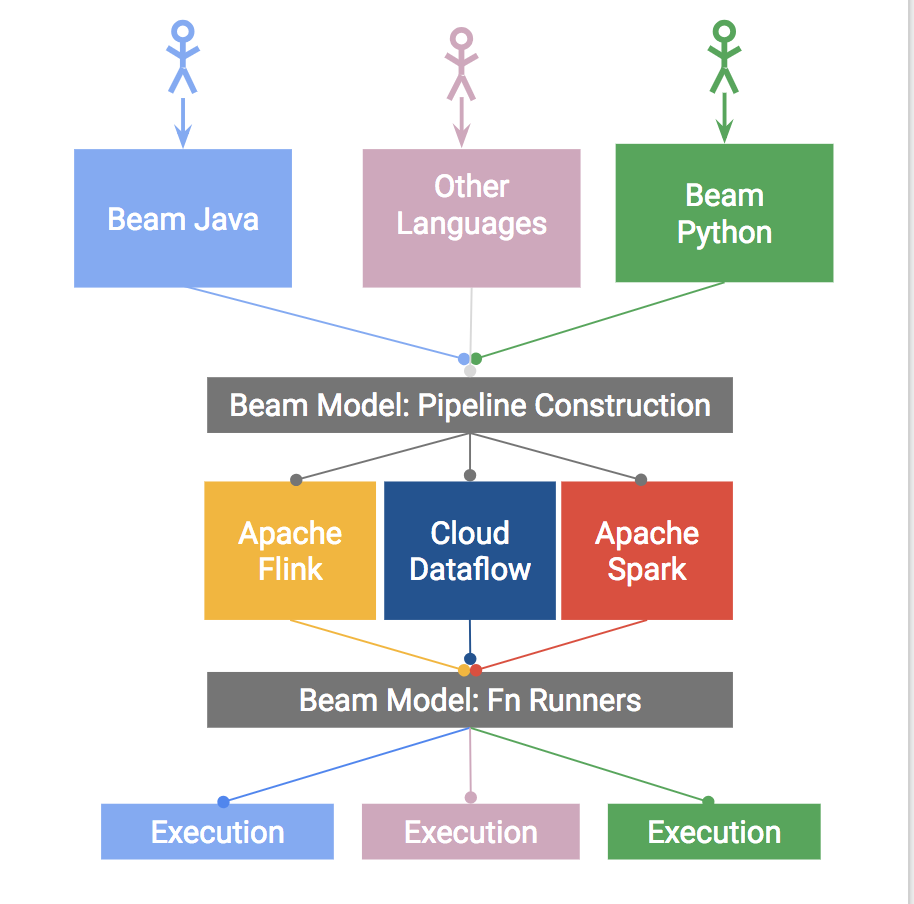
The Apache Beam Vision
- End Users: Create pipelines in a familiar language
- SDK Writers: Make Beam concepts available in new languages
- Runner Writers: Support Beam pipelines in distributed processing environments
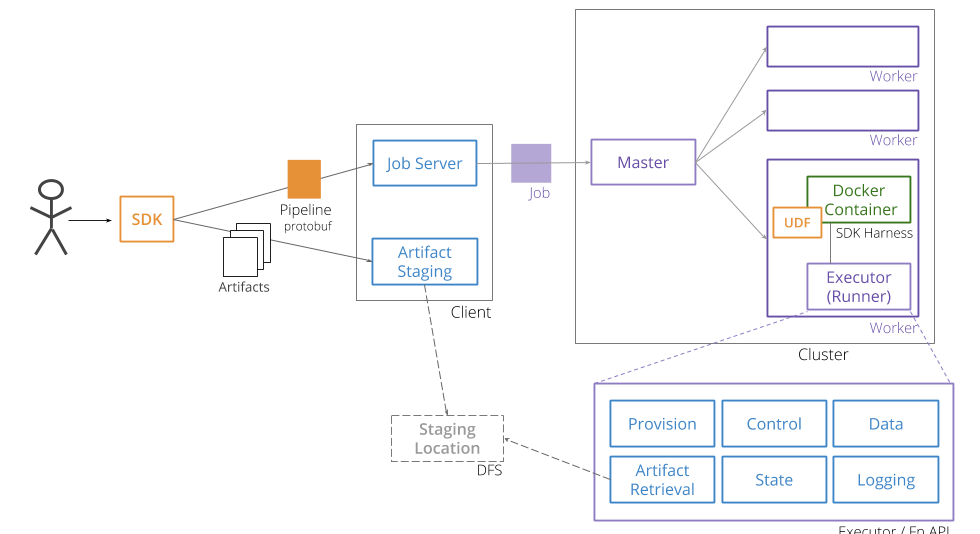
Portable Beam Architecture Overview
Inference Pipeline
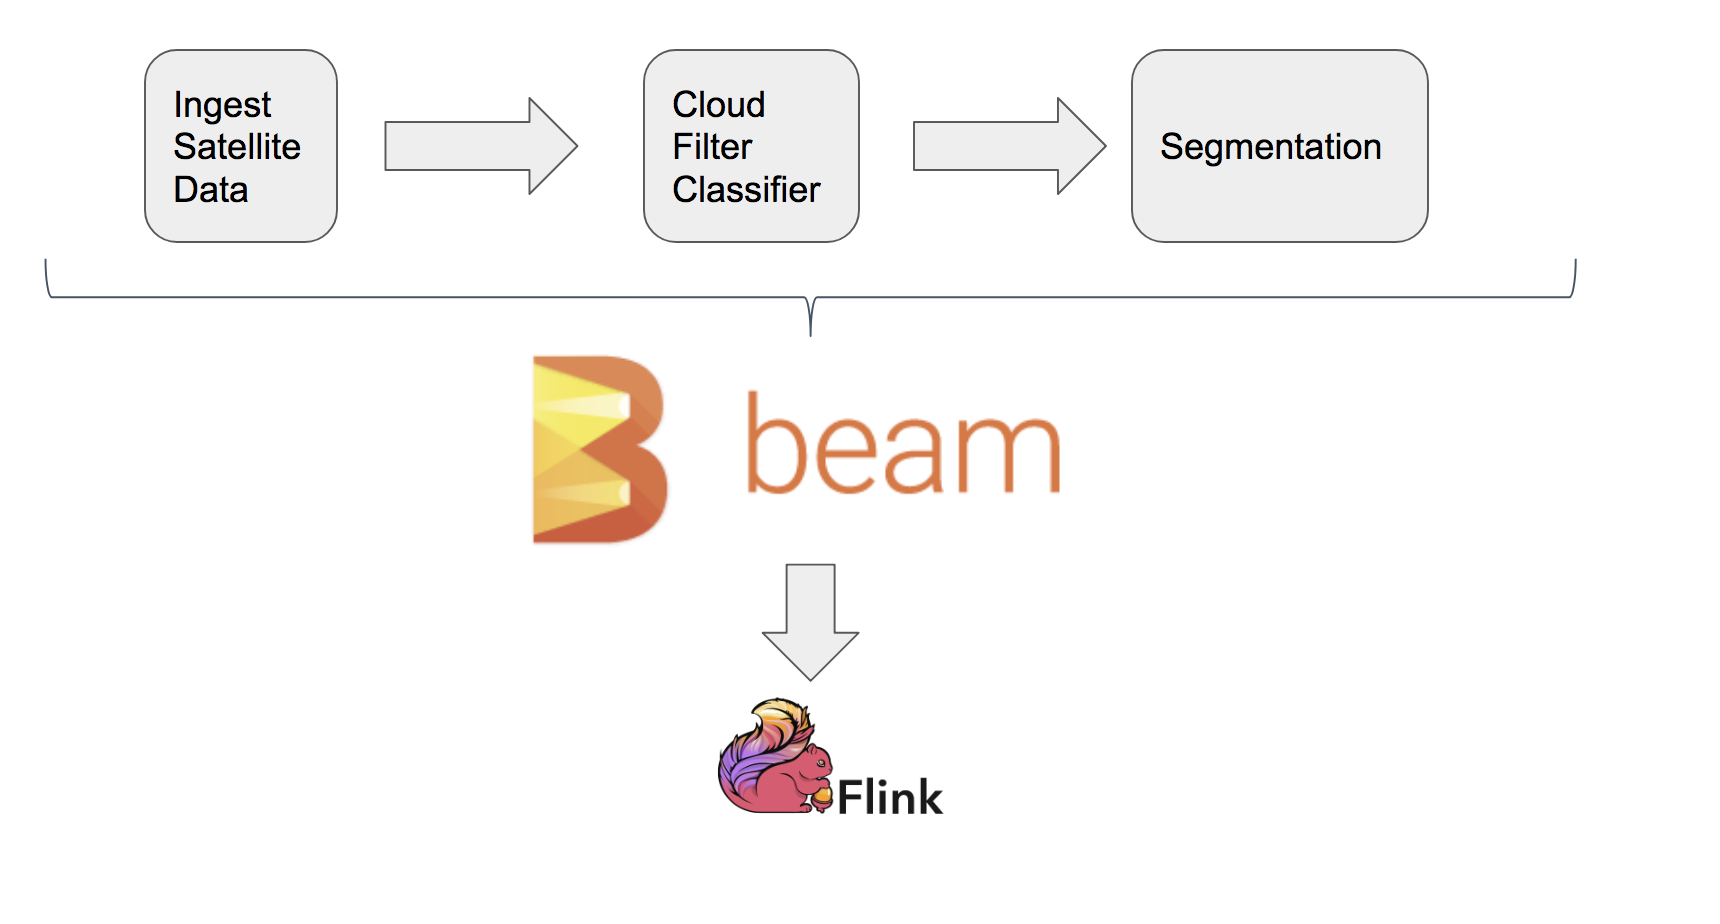
Beam Inference Pipeline
                pipeline_options = PipelineOptions(pipeline_args)
                pipeline_options.view_as(SetupOptions).save_main_session = True
                pipeline_options.view_as(StandardOptions).streaming = True

                with beam.Pipeline(options=pipeline_options) as p:
                    filtered_images = (p | "Read Images" >> beam.Create(glob.glob(known_args.input + '*wms*' + '.png'))
                    | "Batch elements" >> beam.BatchElements(0, known_args.batchsize)3
                    | "Filter Cloudy images" >> beam.ParDo(FilterCloudyFn.FilterCloudyFn(known_args.models)))

                filtered_images | "Segment for Land use" >>
                            beam.ParDo(UNetInference.UNetInferenceFn(known_args.models, known_args.output))
Future Work
Classify Rock Formations
Using Shortwave Infrared images (2.107 - 2.294 nm)
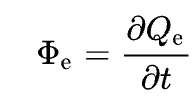
Radiant Energy reflected/transmitted per unit time (Radiant Flux)
Eg: Plants don't grow on rocks
https://en.wikipedia.org/wiki/Radiant_flux
Measure Crop Health
Using Near-Infrared (NIR) radiation
Emitted by plant Chlorophyll and Mesophyll
Chlorophyll content differs between plants and plant stages
Good measure to identify different plants and their health
https://en.wikipedia.org/wiki/Near-infrared_spectroscopy#Agriculture
Use images from Red band
Identify borders, regions without much details with naked eye - Wonder Why?
Images are in Red band
Unsupervised Learning - Clustering
Credits
- Jose Contreras, Matthieu Guillaumin, Kellen Sunderland (Amazon - Berlin)
- Anse Zupanc - Synergise
- Apache Beam: Pablo Estrada, Łukasz Cwik, Ankur Goenka, Maximilian Michels (Google)
- Apache Flink: Fabian Hueske (Ververica)
Links
- Earth on AWS: https://aws.amazon.com/earth/
- Semantic Segmentation - U-Net: https://medium.com/@keremturgutlu/semantic-segmentation-u-net-part-1-d8d6f6005066
- ResNet: https://arxiv.org/pdf/1512.03385.pdf
- U-Net: https://arxiv.org/pdf/1505.04597.pdf
Links (contd)
- Apache Beam: https://beam.apache.org
- Apache Flink: https://flink.apache.org
- Slides: https://smarthi.github.io/BigDataTechWarsaw-satellite-imagery
- Code: https://github.com/smarthi/satellite-images